![]()
![]()
![]()
![]()
How the Model works
|
How the Model works
|
|
|
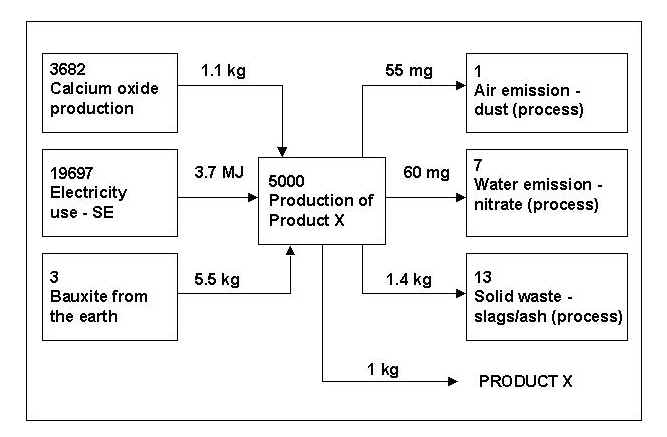
Input tables and flow chartsThe behaviour of an industrial process is modelled by constructing an input table. This table lists all of the other unit operations that the required process is linked to. Thus suppose that a hypothetical top database operation with a code number 5000 produces 1 kg of a product X. Such an operation might have an input table as shown in Table 1.
This input table tells us that this operation consumes 5.5 kg of bauxite, 3.7 MJ of electricity and 1.1 kg of calcium oxide and in the process produces 55 mg of dust which is emitted into the air and 60 mg of nitrate which is emitted into water as well as 1.4 kg of slags and ash. The solid waste entry is listed twice to account for the new EU solid waste categories: note that this does not mean that double-counting occurs, merely that solid wastes can be classified in two separate ways. In this case the bauxite is derived directly from bauxite in the earth. In contrast, the calcium oxide is derived from another process because there is no raw material input specified even though it is known that calcium oxide is derived from limestone. Essentially all that the input table is doing is describing a portion of the flow chart that is needed to produce product X. In extended production sequences, the flow chart describing the system can become extremely complex and confusing. This problem is overcome within the model by using input tables. Each input table is a stand-alone operation and is linked to its surroundings by the inputs and outputs that are indicated within the table. The important feature of this approach is that any operation can be linked to any other operation without restriction. The flow chart needed to produce product X can be derived from the above input table as shown in Figure 5 below.
Figure 5. Flow chart corresponding to the input table shown in Table 1.
| ||||||||||||||||||||||||||||||||||||||||||||||
|
Send mail to:
[email protected] with questions or comments about this web
site. |